Part of: The process that only lives in your head
SOPs
ChatGPT chart analysis for business: use the new charts without trusting fake numbers
For owners who want the monthly chart to update when new rows are added, and the same written check every month.
The first Monday of the month, the chart on the report is last month's picture. The new rows are sitting underneath it. Someone asks for an updated chart, and the usual move is to copy the sheet into a chat and ask again. That is a new job every month.
The short answer
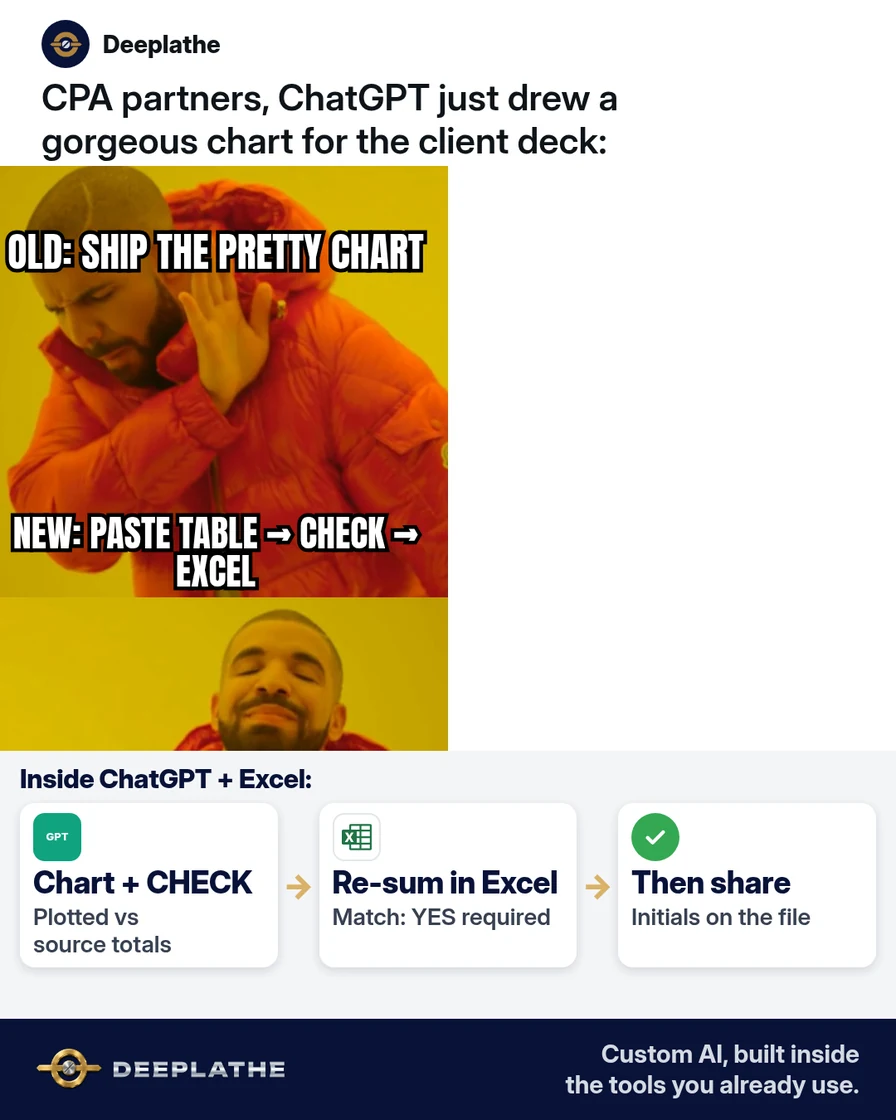
Put the numbers in an Excel table once. The chart updates when you add rows. On the Home tab or the Data tab, Analyze Data suggests charts and insights from that table. If you also want a written check, save one ChatGPT Project with the instructions already in it, and upload the month's file.
Floor vote
Where do the numbers live before the chart goes out?
One vote per device. Change it any time.
Loading votes…
Set it up once (10 minutes)
- Click any cell in the numbers and press Ctrl+T. Excel turns that range into a table and uses the first row as the headers. A chart built on this table picks up rows you add later.
- Click a cell in the table. On the Home tab or the Data tab, choose Analyze Data. Excel suggests charts and written insights from the table. Insert the chart you actually want on the report.
- Optional written check. Create a ChatGPT Project and set its memory to project-only, so the instructions stay with this project. Save this line in the project instructions and leave it there: "explain what changed, flag anything over X%". Put your own percent in place of X. Each month you upload the file. The instructions are already saved.
- Before a work file goes in, open Settings, then Data Controls, and turn "Improve the model for everyone" off. Take personal names, customer names, and account numbers out of the file first.
Set the chart up once
- 1Excel tableCtrl+T so new rows join the chart.
- 2Analyze DataHome or Data tab suggests the chart.
- 3One projectSame check on each monthly upload.
- 4Data controlImprove the model off. Strip names.
What runs by itself afterwards
Add a row inside the table and the chart updates. You rebuild nothing. When the month closes, upload the file to the same project. The project applies the saved line, so the check comes back the same way: what changed, and anything over the percent you set.
Limits. Analyze Data suggests charts and insights. It does not place the chart into a client pack. A row typed outside the table stays off the chart until that row is part of the table. The project checks the file you upload. It does not watch the workbook on your computer. "Improve the model for everyone" off is a data setting. Strip personal or customer data before the upload.
Field check
Field check
Three questions. Honest answers. No score sent anywhere but this page.
01 / 03
What makes a chart pick up new rows?
FAQ
Where do I make the chart update on its own?
Press Ctrl+T so the numbers are an Excel table, then build the chart from that table. New rows inside the table show on the chart.
Where is Analyze Data?
On the Home tab or the Data tab. It suggests charts and insights from the table.
What do I save in the ChatGPT Project?
One line, saved once: explain what changed, flag anything over X%. Use project-only memory so that line stays with the project. The monthly step is the upload.
What do I turn off before a file goes into ChatGPT?
Settings, then Data Controls, then "Improve the model for everyone". Also strip personal or customer data from the file.
Keep these
- Ctrl+T once, so new rows join the chart.
- Home or Data, then Analyze Data, for the suggestion.
- One ChatGPT Project, same instructions on every upload.
- "Improve the model for everyone" off, and no customer data in the file.
If you want this kept inside the tools you already use, Deeplathe can wire it once.
Sources
Related reading
Keep these
The working rules
Turn the numbers into an Excel table once so the chart updates when rows are added. Analyze Data suggests the chart. A saved ChatGPT Project repeats the same check on each monthly upload.