Part of: The process that only lives in your head
SOPs
ChatGPT chart analysis for business: use the new charts without trusting fake numbers
Excel table via Ctrl+T, Analyze Data on the Home or Data tab, and one ChatGPT Project with project-only memory plus fixed instructions.
A monthly chart that was inserted from loose cells stays on last month's range. The control is the table, then one saved project for the written check.
The short answer
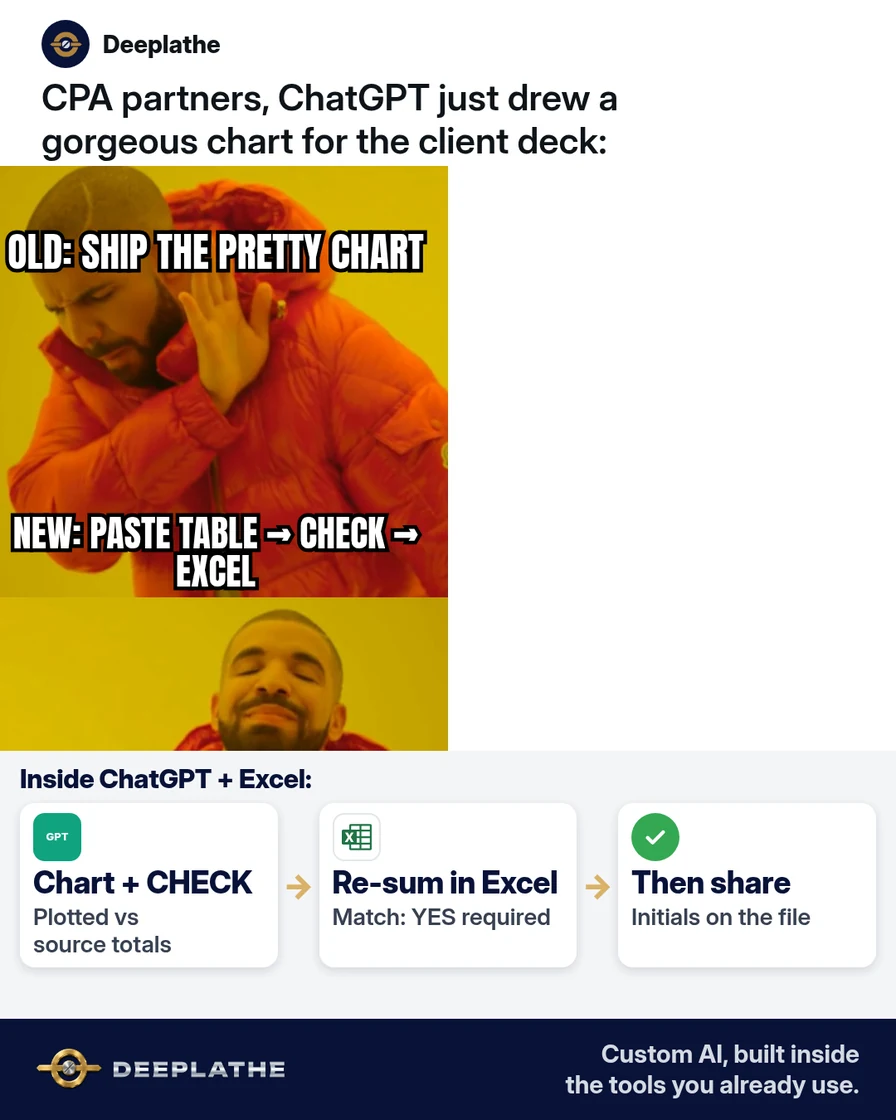
Ctrl+T makes the range a table, so a chart on that table updates when rows are added. Home or Data > Analyze Data suggests charts and insights. A ChatGPT Project with project-only memory and fixed instructions repeats the check on each upload.
Floor vote
Where do the numbers live before the chart goes out?
One vote per device. Change it any time.
Loading votes…
Set it up once (10 minutes)
- Select a cell in the data. Press Ctrl+T (on a Mac, Cmd+T opens the same Create Table dialog). Confirm the header row. Charts and formulas that point at the table expand when rows are added inside it.
- Select a cell in the table. Home tab or Data tab > Analyze Data. Insert one suggested chart. Microsoft 365 Excel shows this button. On the Semi-Annual Enterprise Channel the same button can still say Ideas until Excel updates. The table still feeds the chart either way.
- Create a ChatGPT Project. Set memory to project-only. Save the project instructions exactly once: "explain what changed, flag anything over X%". Substitute the threshold for X. The monthly action is the file upload.
- Settings > Data Controls > turn "Improve the model for everyone" off. Strip personal and customer fields before upload.
Set the chart up once
- 1Excel tableCtrl+T so new rows join the chart.
- 2Analyze DataHome or Data tab suggests the chart.
- 3One projectSame check on each monthly upload.
- 4Data controlImprove the model off. Strip names.
What runs by itself afterwards
Rows added inside the table appear on the chart. Reopening Analyze Data on that table suggests from the current rows. The project applies the stored instructions to each uploaded file, so the check text is the same one saved at setup.
Limits. Analyze Data returns suggestions. Filing the chart is still a person. Cells below the table are outside it. The project reads an upload. It has no live link to the workbook. The data-control switch is not a licence to upload customer lists. Datasets over the size Analyze Data will read need a smaller table. String dates are read as text until a real date column exists.
Field check
Field check
Three questions. Honest answers. No score sent anywhere but this page.
01 / 03
What makes a chart pick up new rows?
FAQ
Which object does the chart bind to?
An Excel table created with Ctrl+T. The chart's source is the table, so appended rows are in range.
Analyze Data path
Home or Data > Analyze Data. Suggestions come from the selected table.
Project instruction string
"explain what changed, flag anything over X%". Project-only memory keeps that string on the project. Upload replaces retyping it.
Data control
Settings > Data Controls > "Improve the model for everyone" off. Strip personal or customer data in the sheet first.
Keep these
- Table first (Ctrl+T), chart on the table.
- Analyze Data for the suggestion.
- One project, one instruction string, monthly upload.
- Data control off, identifiers stripped.
Deeplathe can leave this inside the workbook and the project you already have.
Sources
Related reading
Keep these
The working rules
Ctrl+T, then Home or Data > Analyze Data. Optional ChatGPT Project with project-only memory and the fixed line "explain what changed, flag anything over X%". Settings > Data Controls > Improve the model for everyone off, and personal or customer data stripped before upload.